This is not a comparison of which Network is better or worse. This analysis is purely done for valuation purposes. In order to be able to compare valuations of different networks we’ve used the Price-to-Sales (P/S) ratio or better known as Price-to-Earnings (P/E) ratio in stocks. To use the P/S ratio in crypto we divide the MarketCap (Price) by the Network Revenues (Sales). In order to calculate the right transactions on the network we use the client transactions and use the price of the transaction. Client transactions times the transaction fee on an annualized basis gives us the Network Revenue or Sales in the abovementioned equation. In short: P/S ratio: MarketCap / Annualized Network Revenues
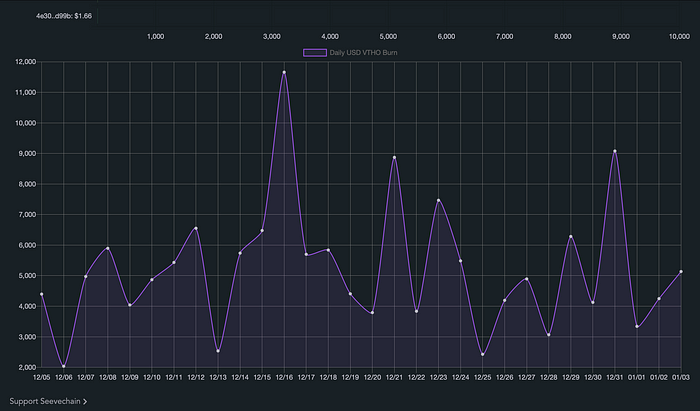
Now let’s look at the VeChain Network Sales, which is measured in terms of VTHO daily burns in USD. Over the last 30 days the average daily VTHO burn was around $6,000 (see chart below). Annualizing this data over a year gives a total sales revenue of $2,190,000
With a total MarketCap today of $1,500,000,000 the P/S ratio is $1,500,000,000 / $2,190,000 = 685

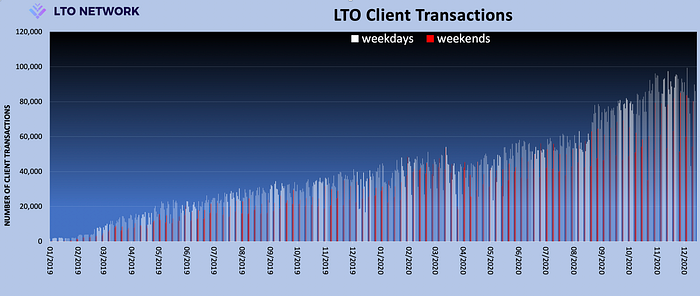
In order to calculate the client transactions of LTO Network we need to know the Anchor transactions of the Network. These are currently 99.8%[1] of all transactions. The average number of transactions in the last month was 85,000 per day. As clients pay 0.35 LTO per tx the daily revenues are around $4,500 and $1,642,000 per year. The total MarketCap is currently $45,000,000. Based on abovementioned data the P/S ratio is $45,000,000 / $1,642,000 = 27. High P/S ratios aren’t necessarily bad as it could also indicate that the company is growing fast and the coin hodlers are expecting a quick pick up in transactions (revenues) in the coming year. In case of VeChain this could well be the case as people expect a lot from Toolchain which was introduced in 2019. VeChain hodlers actually expect a big pick up in transactions in 2021.

On the LTO side we see a steady climb in transactions since the start in 2019. Based on this growth trend we could calculate an extrapolated sales revenue for 2022, and a P/E ratio based on this data is called a P/S 1yr forward, which currently is around 9. As said before, based on VeChain’s transactions we can’t spot a clear uptrend to calculate a forward P/S ratio.

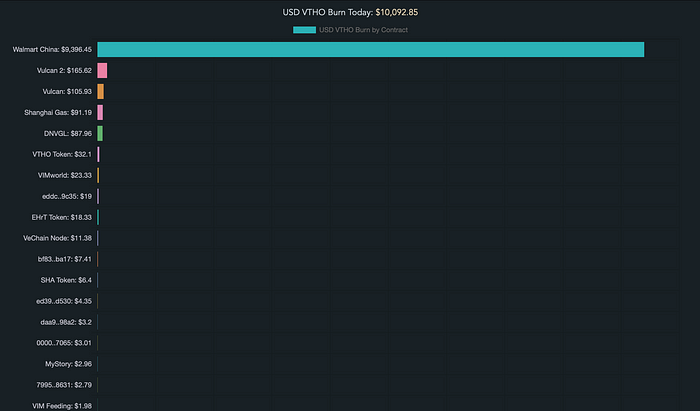
Both networks have a transparent overview of what their clients are generating in terms of transaction fees. What’s obvious is that both are still in their adoption phase and lack a broad number of different clients. However, what stands out in our VeChain’s analysis is the fact that more than 90% of all its transactions are coming from one sole client, Walmart China. In LTO’s case, we see 65% of all transactions coming from one important integrator (LegalThings). However, there are several different clients behind this integrator, so it is hard to calculate the client dependency rate on the total network.
Conclusion: the VeChain P/S ratio is lower than the ratio of BTC (861) but a lot higher than the P/S of LTO Network. Benchmarking VET vs. BTC would give VET a fair value of (861/685 times VET-price ($0.023)) $0.028
The P/S ratio of LTO Network is extremely low, actually one of the lowest of all Proof-of-Stake tokens in crypto space. Benchmarking LTO vs. BTC would give it a fair value of (861/27 times LTO price ($0.165)) $5.26
When we compare the two P/S metrics of LTO and VET we can say that LTO Network looks very cheap and its relative value against VET is low. Benchmarking VET would give LTO an upside of ((685/27*$0.165)-/- current price) of $4.02.
Both tokens look favorable vs. Bitcoin’s P/S ratio. And both networks look to be set for huge growth in the near future. Based on the fair value of both tokens and using BTC as benchmark, most price growth should come from LTO Network. Its current price of 16/17 cents are not proportionate to its fair value. In fact, the upside for the LTO token price is enormous.

[1] Lto.tools/transactions
